Green Deal Data Observatory
Green Deal Data Observatory
Home
Services
Posts
Data API
Contributors
Use Cases
Code
Topics
Talks
Contact
Get Involved
Light
Dark
Automatic
Posts
Connecting the Dots to Environmental Degradation Open Data
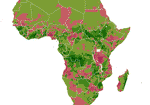
Using sub-national geographical information, we can connect air pollution measurements and satellite images of light pollution or deforestration with social and economic indicators, and even individual opinion polling data.
Daniel Antal
,
Milos Popovic
Last updated on May 12, 2021
4 min read
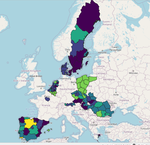
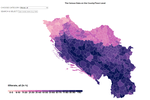
Regional Geocoding Harmonization Case Study - Regional Climate Change Awareness Datasets
In the previous example we created a longitudional dataset that contains data on the attitudes European people in various countries, provinces and regions thought climate change was a serious world problem back in 2013, 2015, 2017 and 2019. We will now fix the geographical information for mapping.
Daniel Antal
Last updated on Mar 28, 2021
4 min read
R-bloggers
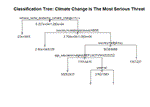
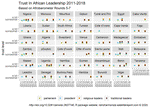
Where Are People More Likely To Treat Climate Change as the Most Serious Global Problem?
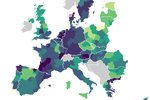
We created a longitudinal dataset that contains data on the attitudes European people in various countries, provinces and regions thought climate change was a serious world problem back in 2013, 2015, 2017 and 2019. We join the data with air pollution data so that we can see how serious is the environmental degradation in the smaller area of each (anonymous) respondent.
Daniel Antal
Last updated on Mar 28, 2021
10 min read
R-bloggers
Retrospective Survey Harmonization Case Study - Climate Awareness Change in Europe 2013-2019.
In this example we are working with data from surveys that were ex ante harmonized to a certain degree – in our tutorials we are choosing questions that were asked in the same way in many natural languages. For example, you can compare what percentage of the European people in various countries, provinces and regions thought climate change was a serious world problem back in 2013, 2015, 2017 and 2019.
Daniel Antal
Last updated on Mar 28, 2021
18 min read
R-bloggers
What is Retrospective Survey Harmonization?
Retrospective survey harmonization allows the comparison of opinion poll data conducted in different countries or time. In this example we are working with data from surveys that were ex ante harmonized to a certain degree – in our tutorials we are choosing questions that were asked in the same way in many natural languages. For example, you can compare what percentage of the European people in various countries, provinces and regions thought climate change was a serious world problem back in 2013, 2015, 2017 and 2019.
Daniel Antal
Last updated on Mar 28, 2021
5 min read
R-bloggers
Open Data Day Interview: Mapping Data with Milos Popovic
Milos Popovic is a researcher, a data scientist, Marie Curie postdoc & Top 10 dataviz & R contributor on Twitter according to NodeXL. He is going to join the Data & Lyrics team on International Open Data Day to help us put harmonized environmental degradation perception and environmental sensory data on maps. We asked him four questions about his passion, mapping data. Please join us 6 March 2021 9.30 EST / 15.30 CET for an informal digital coffee.
Daniel Antal
Last updated on Mar 28, 2021
5 min read
Eurobarometer Surveys Used In Our Project
In our
tutorial series
, we are going to harmonize the following questionnaire items from five Eurobarometer harmonized survey files. The Eurobarometer survey files are harmonized across countries, but they are only partially harmonized in time.
Daniel Antal
Last updated on Mar 28, 2021
6 min read
R-bloggers
«
Cite
×