Open Data is Like Gold in the Mud Below the Chilly Waves of Mountain Rivers
Introducing Our Service Development Team

As the founder of the automated data observatories that are part of Reprex’s core activities, what type of data do you usually use in your day-to-day work?
The automated data observatories are results of syndicated research, data pooling, and other creative solutions to the problem of missing or hard-to-find data. The music industry is a very fragmented industry, where market research budgets and data are scattered in tens of thousands of small organizations in Europe. Working for the music and film industry as a data analyst and economist was always a pain because most of the efforts went into trying to find any data that can be analyzed. I spent most of the last 7-8 years trying to find any sort of information—from satellites to government archives—that could be formed into actionable data. I see three big sources of information: textual,numeric, and continuous recordings for on-site, offsite, and satellite sensors. I am much better with numbers than with natural language processing, and I am improving with sensory sources. But technically, I can mint any systematic information—the text of an old book, a satellite image, or an opinion poll—into datasets.
For you, what would be the ultimate dataset, or datasets that you would like to see in the Green Deal Data Observatory?
Our retroharmonize and regions packages can create regional statistics from Eurobarometer and Afrobarometer surveys on how people think locally about climate change. I would like to combine this with local information on observable climate change, such as drought, urban heat, and extreme weather conditions. Do people have to feel the pain of climate change to believe in the phenomenon? How do self-reported mitigation steps correlate with what people already feel in their local environment? Suzan is talking about measuring mitigation and damage control, because she’s aware of the already present health risks in overheating urban environments. I am more interested in what people think.
 on connecting local tax revenues, climate awareness poll data and drought data in Belgium - we want to extend this to Europe and then to Africa. We also published the code how to do it with tutorials [1](/post/2021-03-05-retroharmonize-climate/), [2](https://rpubs.com/antaldaniel/regions-OOD21) for our [International Open Data Day 2021 Event](https://greendeal.netlify.app/talk/reprex-open-data-day-2021/).](/img/flood-risk/belgium_spei_2018.png)
Is there a number or piece of information that recently surprised you? If so, what was it?
There were a few numbers that surprised me, and some of them were brought up by our observatory teams. Karel is talking about the fact that not all green energy is green at all: many hydropower stations contribute to the greenhouse effect and not reduce it. Annette brought up the growing interest in the Dalmatian breed after the Disney 101 Dalmatians movies, and it reminded me of the astonishing growth in interest for chess sets, chess tutorials, and platform subscriptions after the success of Netflix’s The Queen’s Gambit.
](/media/img/blogposts_2021/queens_gambit_bloomberg.png)
Annette is talking about the importance of cultural influencers, and on that theme, what could be more exciting that Netflix’s biggest success so far is not a detective series or a soap opera but a coming-of-age story of a female chess prodigy. Intelligence is sexy, and we are in the intelligence business.
But to tell a more serious and more sobering number, I recently read with surprise that there are more people smoking cigarettes on Earth in 2021 than in 1990. Population growth in developing countries replaced the shrinking number of developed country smokers. While I live in Europe, where smoking is strongly declining, it reminds me that Europe’s population is a small part of the world. We cannot take for granted that our home-grown experiences about the world are globally valid.
Do you have a good example of really good, or really bad use of data?
FiveThirtyEight.com had a wonderful podcast series, produced by Jody Avirgan, called What’s the Point. It is exactly about good and bad uses of data, and each episode is super interesting. Maybe the most memorable is Why the Bronx Really Burned. New York City tried to measure fire response times, identify redundancies in service, and close or re-allocate fire stations accordingly. What resulted, though, was a perfect storm of bad data: The methodology was flawed, the analysis was rife with biases, and the results were interpreted in a way that stacked the deck against poorer neighborhoods. It is similar to many stories told in a very compelling argument by Catherine D’Ignazio and Lauren F. Klein in their much celebrated book, Data Feminism. Usually, the bad use of data starts with a bad data collection practice. Data analysts in corporations, NGOs, public policy organizations and even in science usually analyze the data that is available.
You can find these examples, together with many more that our contributors recommend, in the motivating examples of Create New Datasets and the Remain Critical parts of our onboarding material. We hope that more and more professionals and citizen scientist will help us to create high-quality and open data.
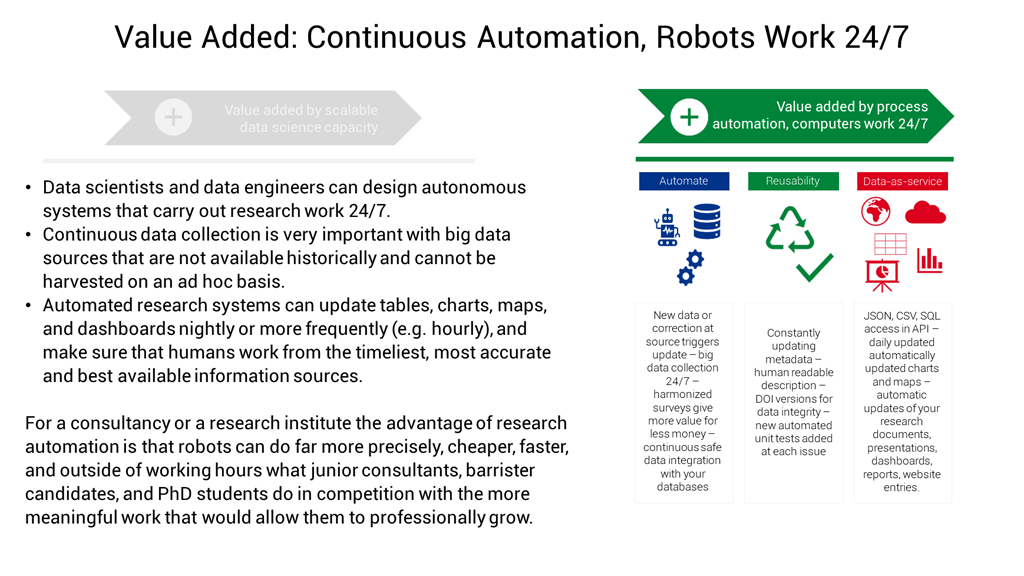
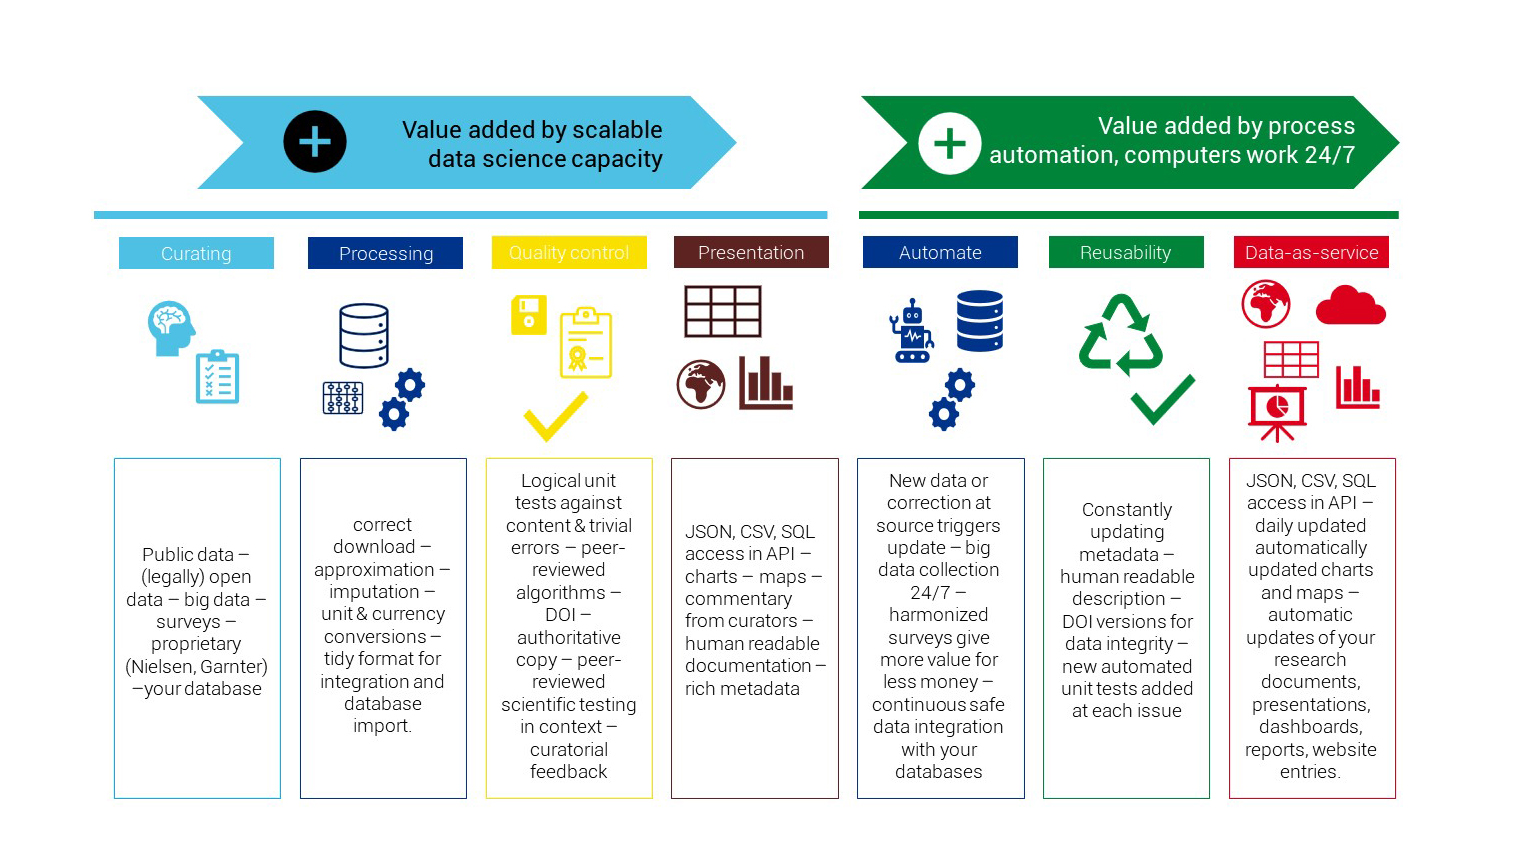
The real power lies in designing a data collection program. A consistent data collection program usually requires an investment that only powerful organizations, such as government agencies, very large corporations, or the richest universities can afford. You cannot really analyze the data that is not collected and recorded; and usually what is not recorded is more interesting than what is. Our observatories want to democratize the data collection process and make it more available, more shared with research automation and pooling.

From your perspective, what do you see being the greatest problem with open data in 2021?
I have been involved with open data policies since 2004. The problem has not changed much: more and more data are available from governmental and scientific sources, but in a form that makes them useless. Data without clear description and clear processing information is useless for analytical purposes: it cannot be integrated with other data, and it cannot be trusted and verified. If researchers or government entities that fall under the Open Data Directive release data for reuse in a way that does not have descriptive or processing metadata, it is almost as if they did not release anything. You need this additional information to make valid analyses of the data, and to reverse-engineer them may cost more than to recollect the data in a properly documented process. Our developers, particularly Leo and Pyry are talking eloquently about why you have to be careful even with governmental statistical products, and constantly be on the watch out for data quality.
 is not only publishing descriptive and processing metadata alongside with our data, but we also make all critical elements of our processing code available for peer-review on [rOpenGov](/authors/ropengov/)](/media/img/observatory_screenshots/GDO_API_metadata_table.png)
What do you think the Green Deal Data Observatory, and our other automated observatories do, to make open data more credible in the European economic policy community and be accepted as verified information?
Most of our work is in research automation, and a very large part of our efforts are aiming to reverse engineer missing descriptive and processing metadata. In a way, I like to compare ourselves to the working method of the open-source intelligence platform Bellingcat. They were able to use publicly available, scattered information from satellites and social media to identify each member of the Russian military company that illegally entered the territory of Ukraine and shot down the Malaysian Airways MH17 with 297, mainly Dutch, civilians on board.

We do not do such investigations but work very similarly to them in how we are filtering through many data sources and attempting to verify them when their descriptions and processing history is unknown. In the last years, we were able to estore the metadata of many European and African open data surveys, economic impact, and environmental impact data, or many other open data that was lying around for many years without users.
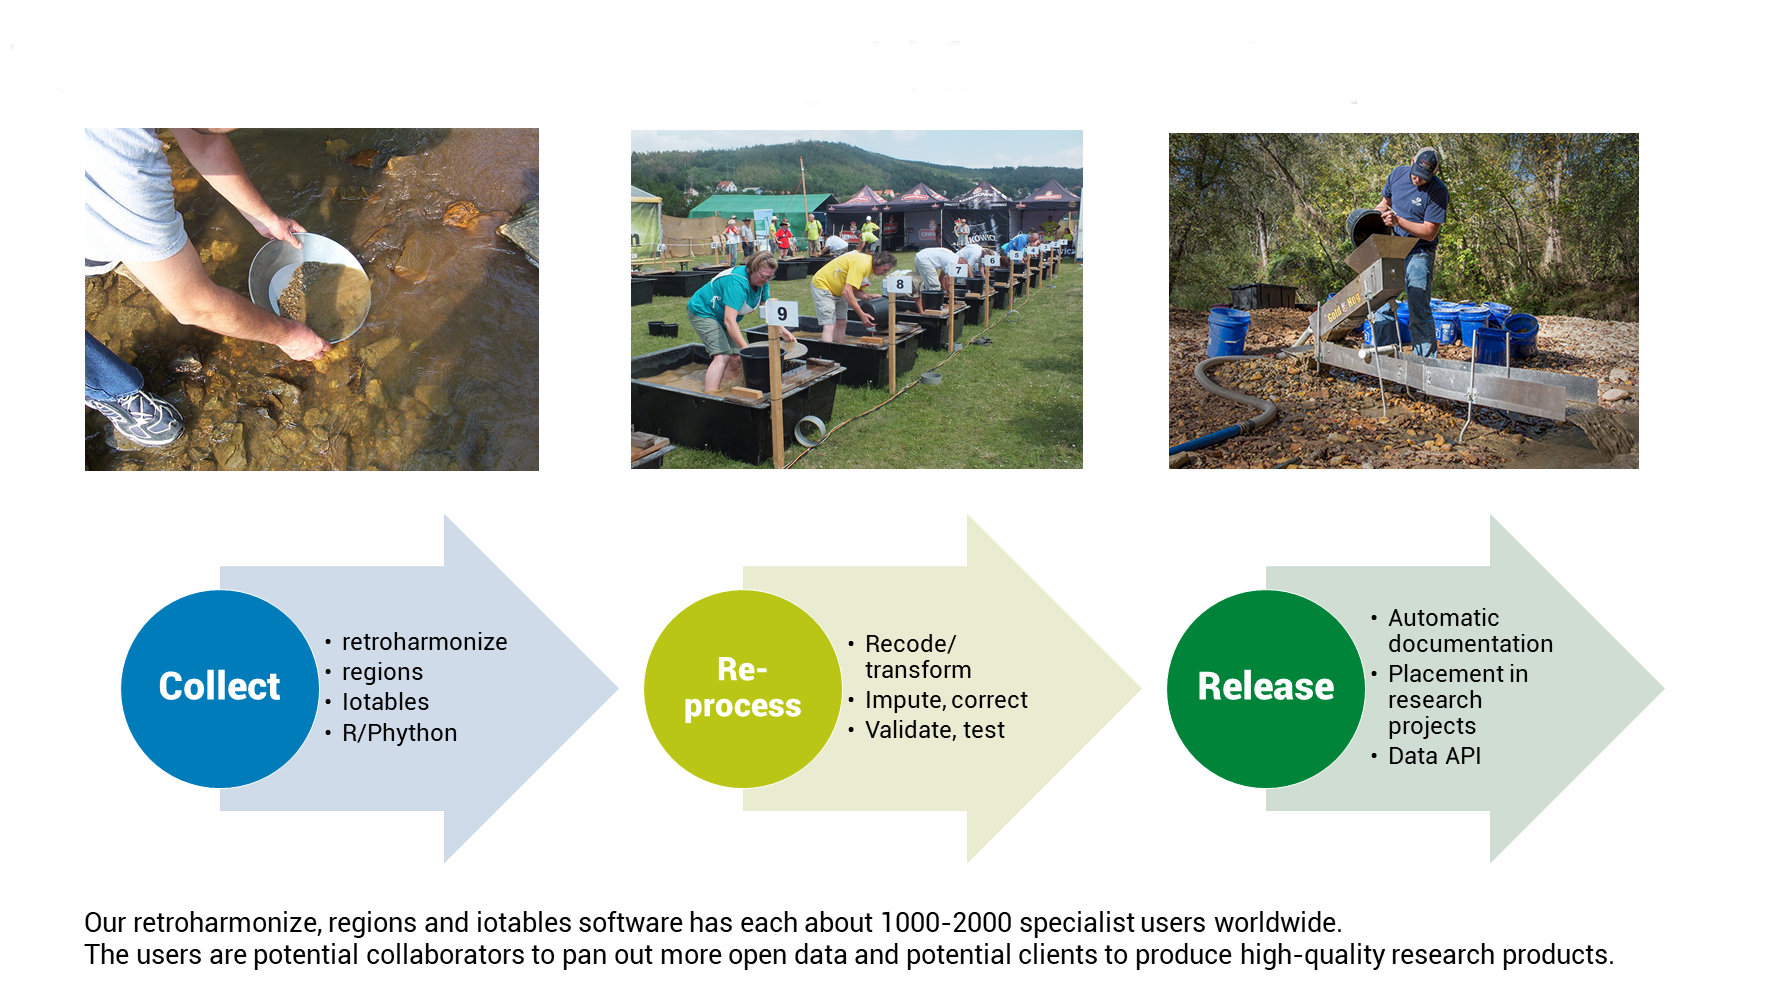
Open data is like gold in the mud below the chilly waves of mountain rivers. Panning it out requires a lot of patience, or a good machine. I think we will come to as surprising and strong findings as Bellingcat, but we are not focusing on individual events and stories, but on social and environmental processes and changes.
, [developer](/authors/developer) or [business developer](/authors/team), or share your data in our public repository [Green Deal Data Observatory on Zenodo](https://zenodo.org/communities/greendeal_observatory/).](/media/img/observatory_screenshots/greendeal_and_zenodo.png)
Join us
Join our open collaboration Green Deal Data Observatory team as a data curator, developer or business developer. More interested in antitrust, innovation policy or economic impact analysis? Try our Economy Data Observatory team! Or your interest lies more in data governance, trustworthy AI and other digital market problems? Check out our Digital Music Observatory team!