Is Drought Risk Uninsurable?
An open data case study for Belgium
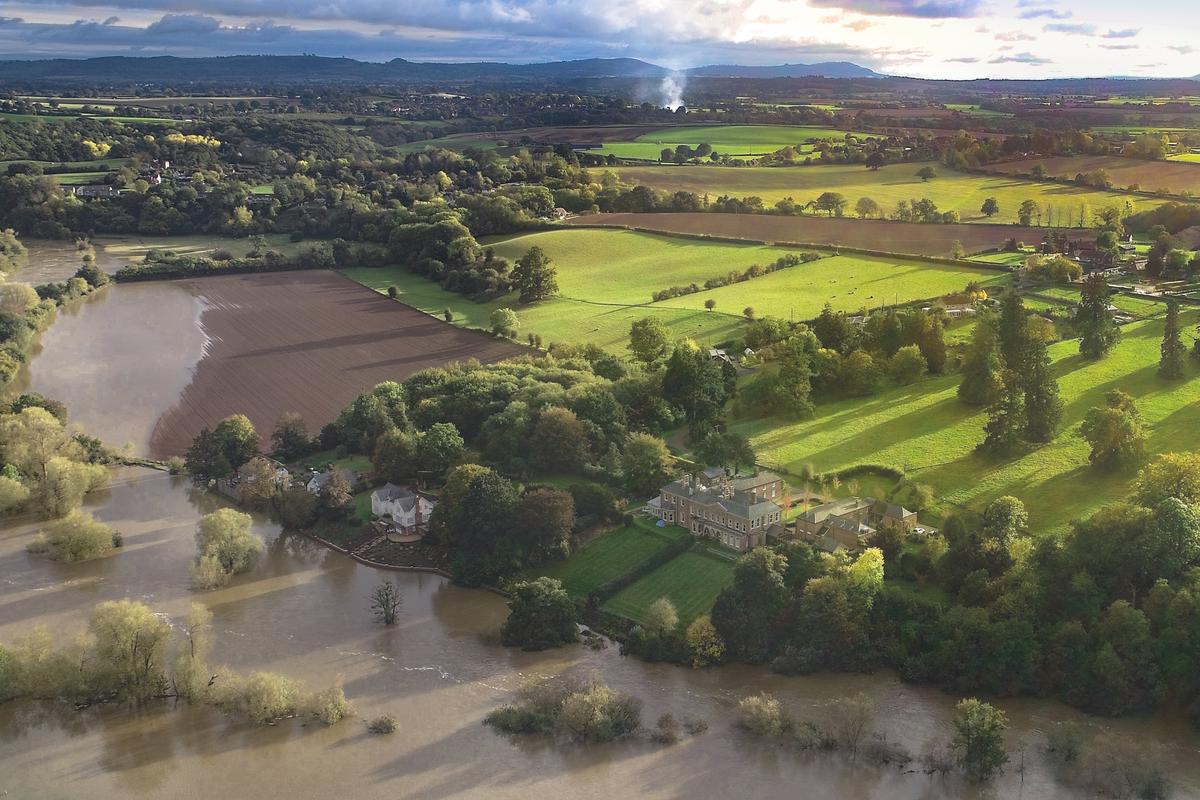 Flood by nickrad
Climate change is real and it is everywhere. Whereas island nations in the Pacific are threatened with rising sea levels, Europe suffers from ever more frequent scorching summers and resulting drought. Take the case of Belgium, where heat waves in 2018 or 2020 have exacerbated an already fragile drought risk profile. An all too tangible effect is that houses built in areas where groundwater reservoirs are dwindling start to rupture. What adds insult to injury is that insurers appear unwilling to pay for damages: these climate-related risks simply did not feature in insurance policies made up decades ago. The public and the media have called upon the secretary of state responsible for consumer protection to come up with a solution. (Download this document in pdf.)
The Belgian insurance sector and government are currently investigating how to address the ecological and financial issue. Should the risk premium be raised on all insurance policies in an effort to spread risk, or should only policy holders in designated risk areas be subject to a raise in premia? Should urban planning initiatives and real estate projects be required to assess these new types of risk beforehand?
Driven by the Open Data Directive, we went in search for data at government websites such as waterinfo.be. That proved harder than you would want, with quite a number of technological barriers to cross. We independently explored the matter ourselves and came up with this: a dynamic map that pictures the spatial distribution of drought risk - as measured by a climate indicator known as the standardised recipitation-evapotranspiration index.
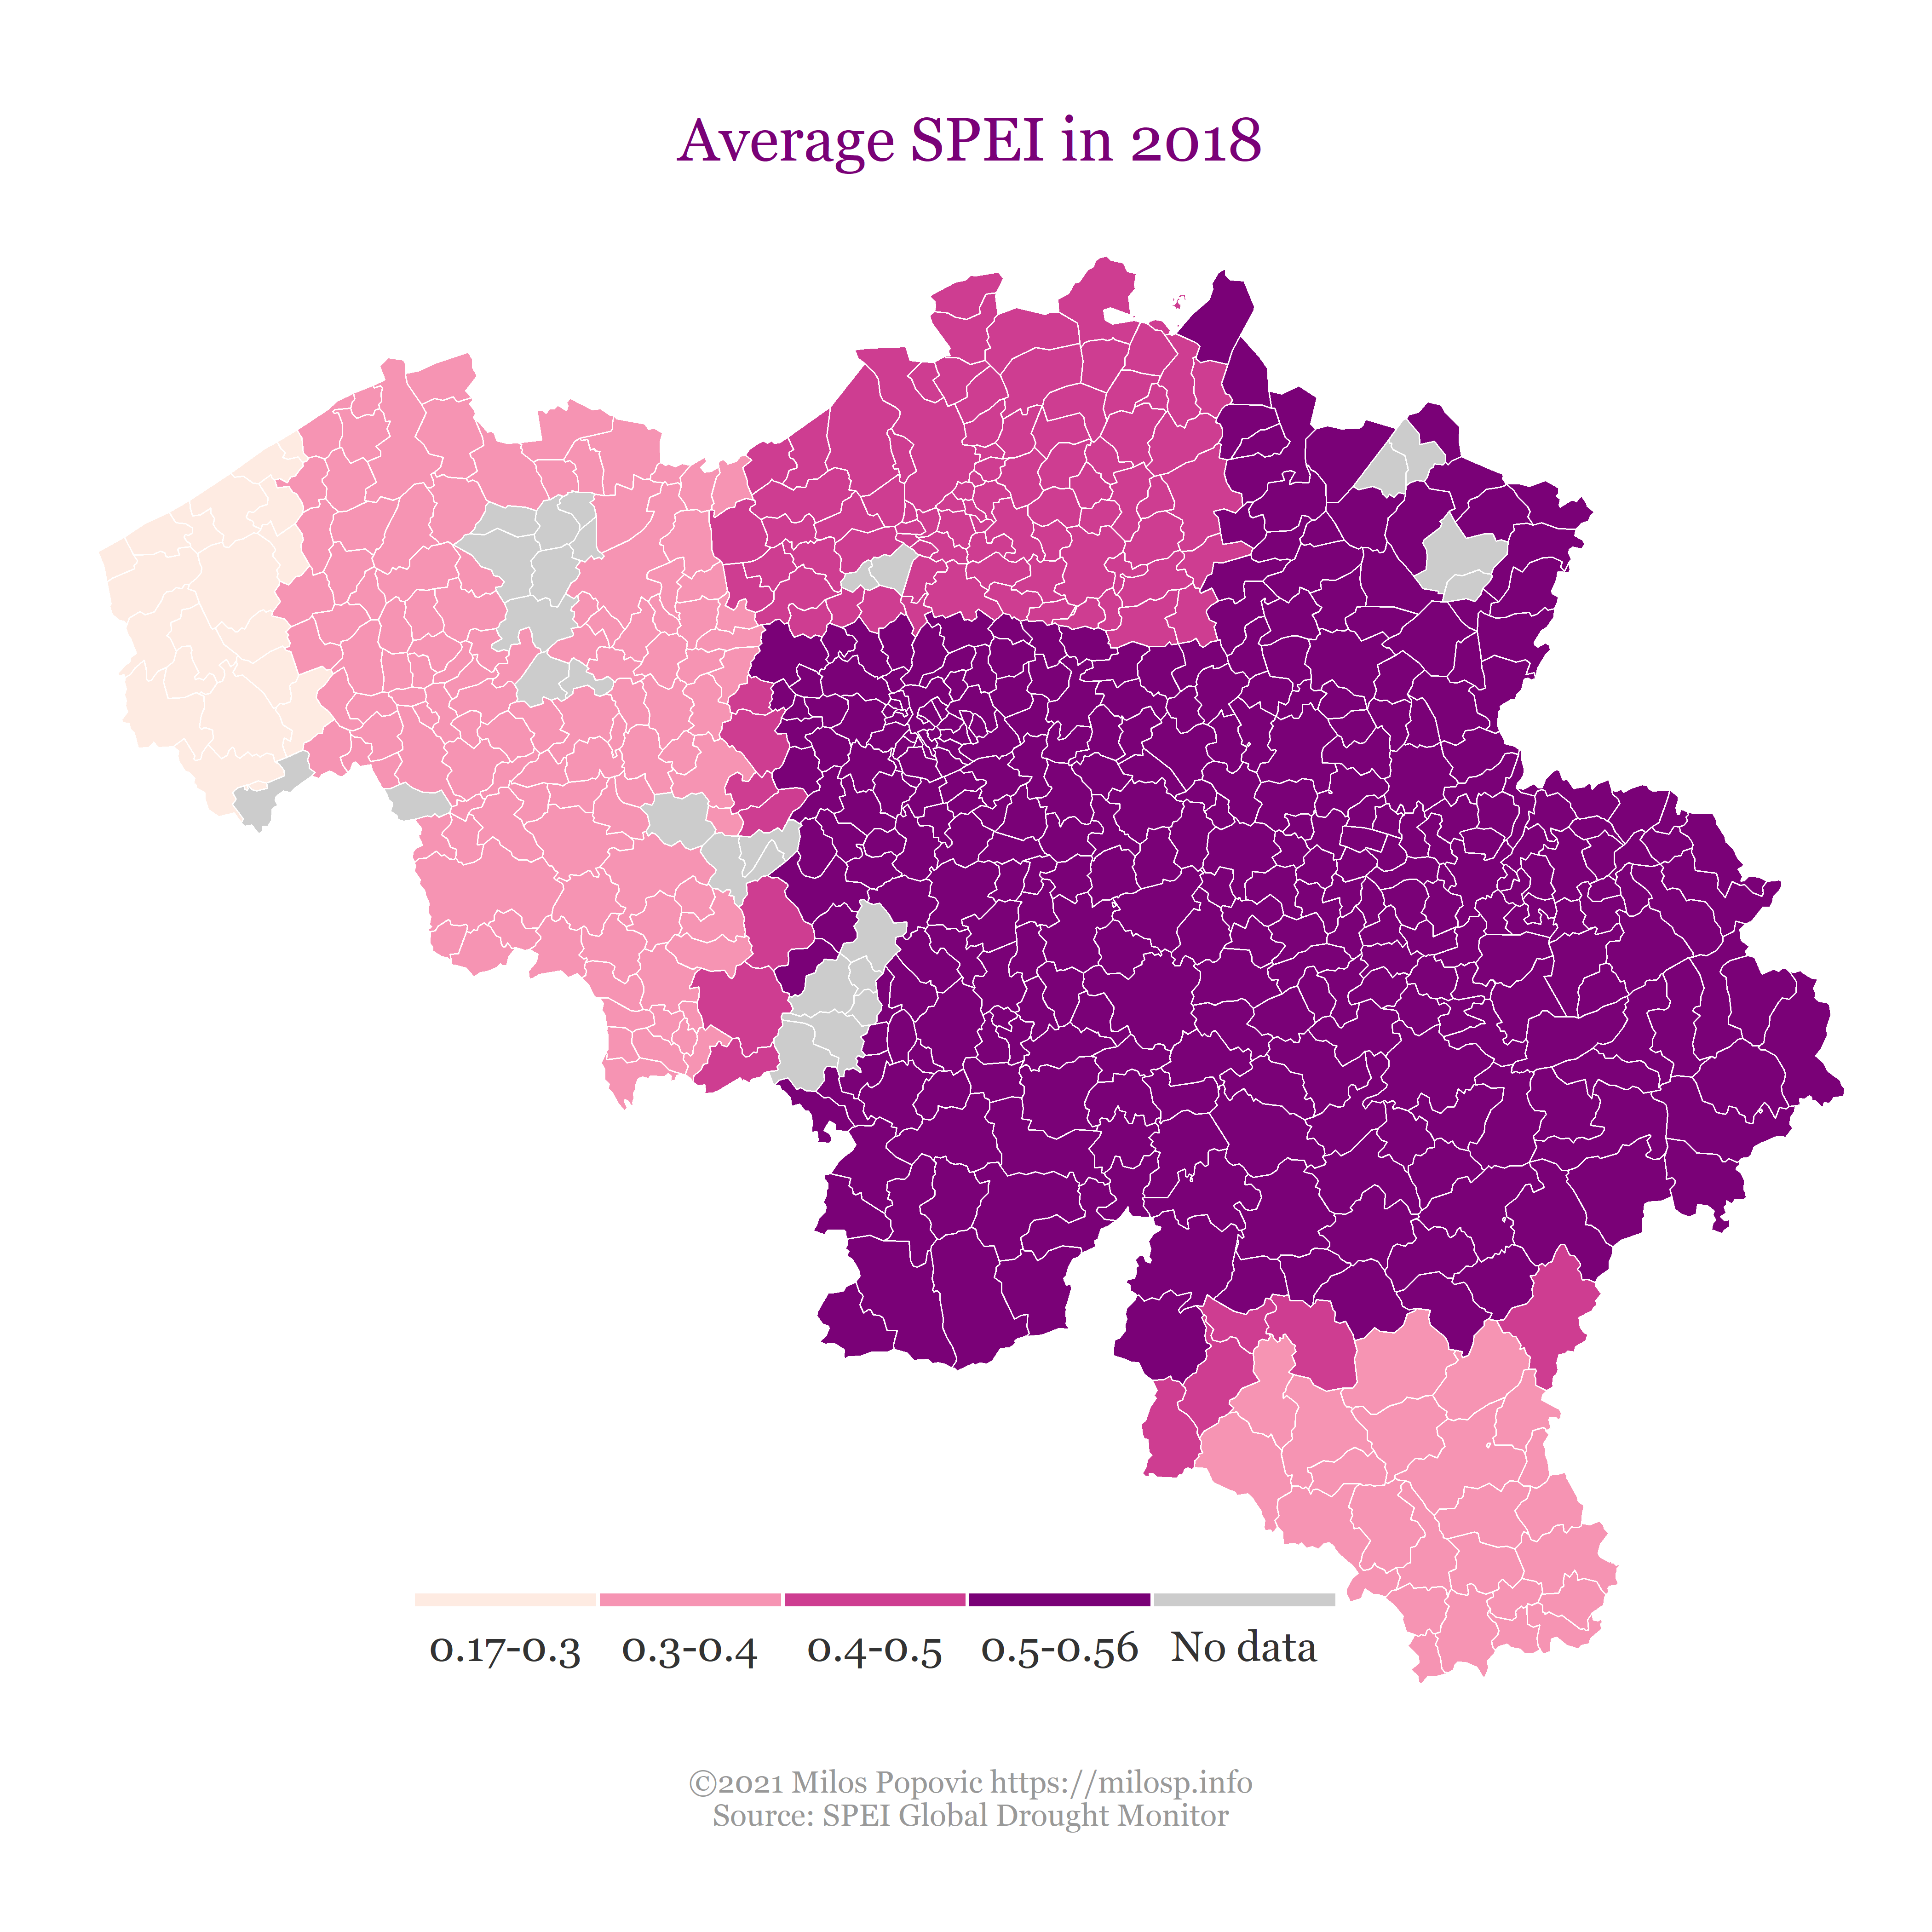
This SPEI index, measured as a standardized variate, shows the deviations of the current climatic balance (precipitation minus evapotranspiration potential) in the long run and is presented on a monthly basis. As the SPEI in this form is more predictive for flood risk, we simply inverted the index to suggest a measure of drought risk1.
Readers familiar with the “Kingdom by the sea” will remark that Belgium cannot possibly have a lack of precipitation. It rains more than the average Belgian cares for in the country. As a result, the water management system has historically been based on getting the water out as quickly as possible to the sea, in particular through the Ijzer, Schelde and Maas rivers. Add the abundance of concrete in the densely populated country - and its grossly mismanaged urban planning - and the capacity to hold water in surface and ground reservoirs is severely impaired. With climate change in full swing, these historical practices come back to haunt Belgium.
Are Belgians aware of climate risk?
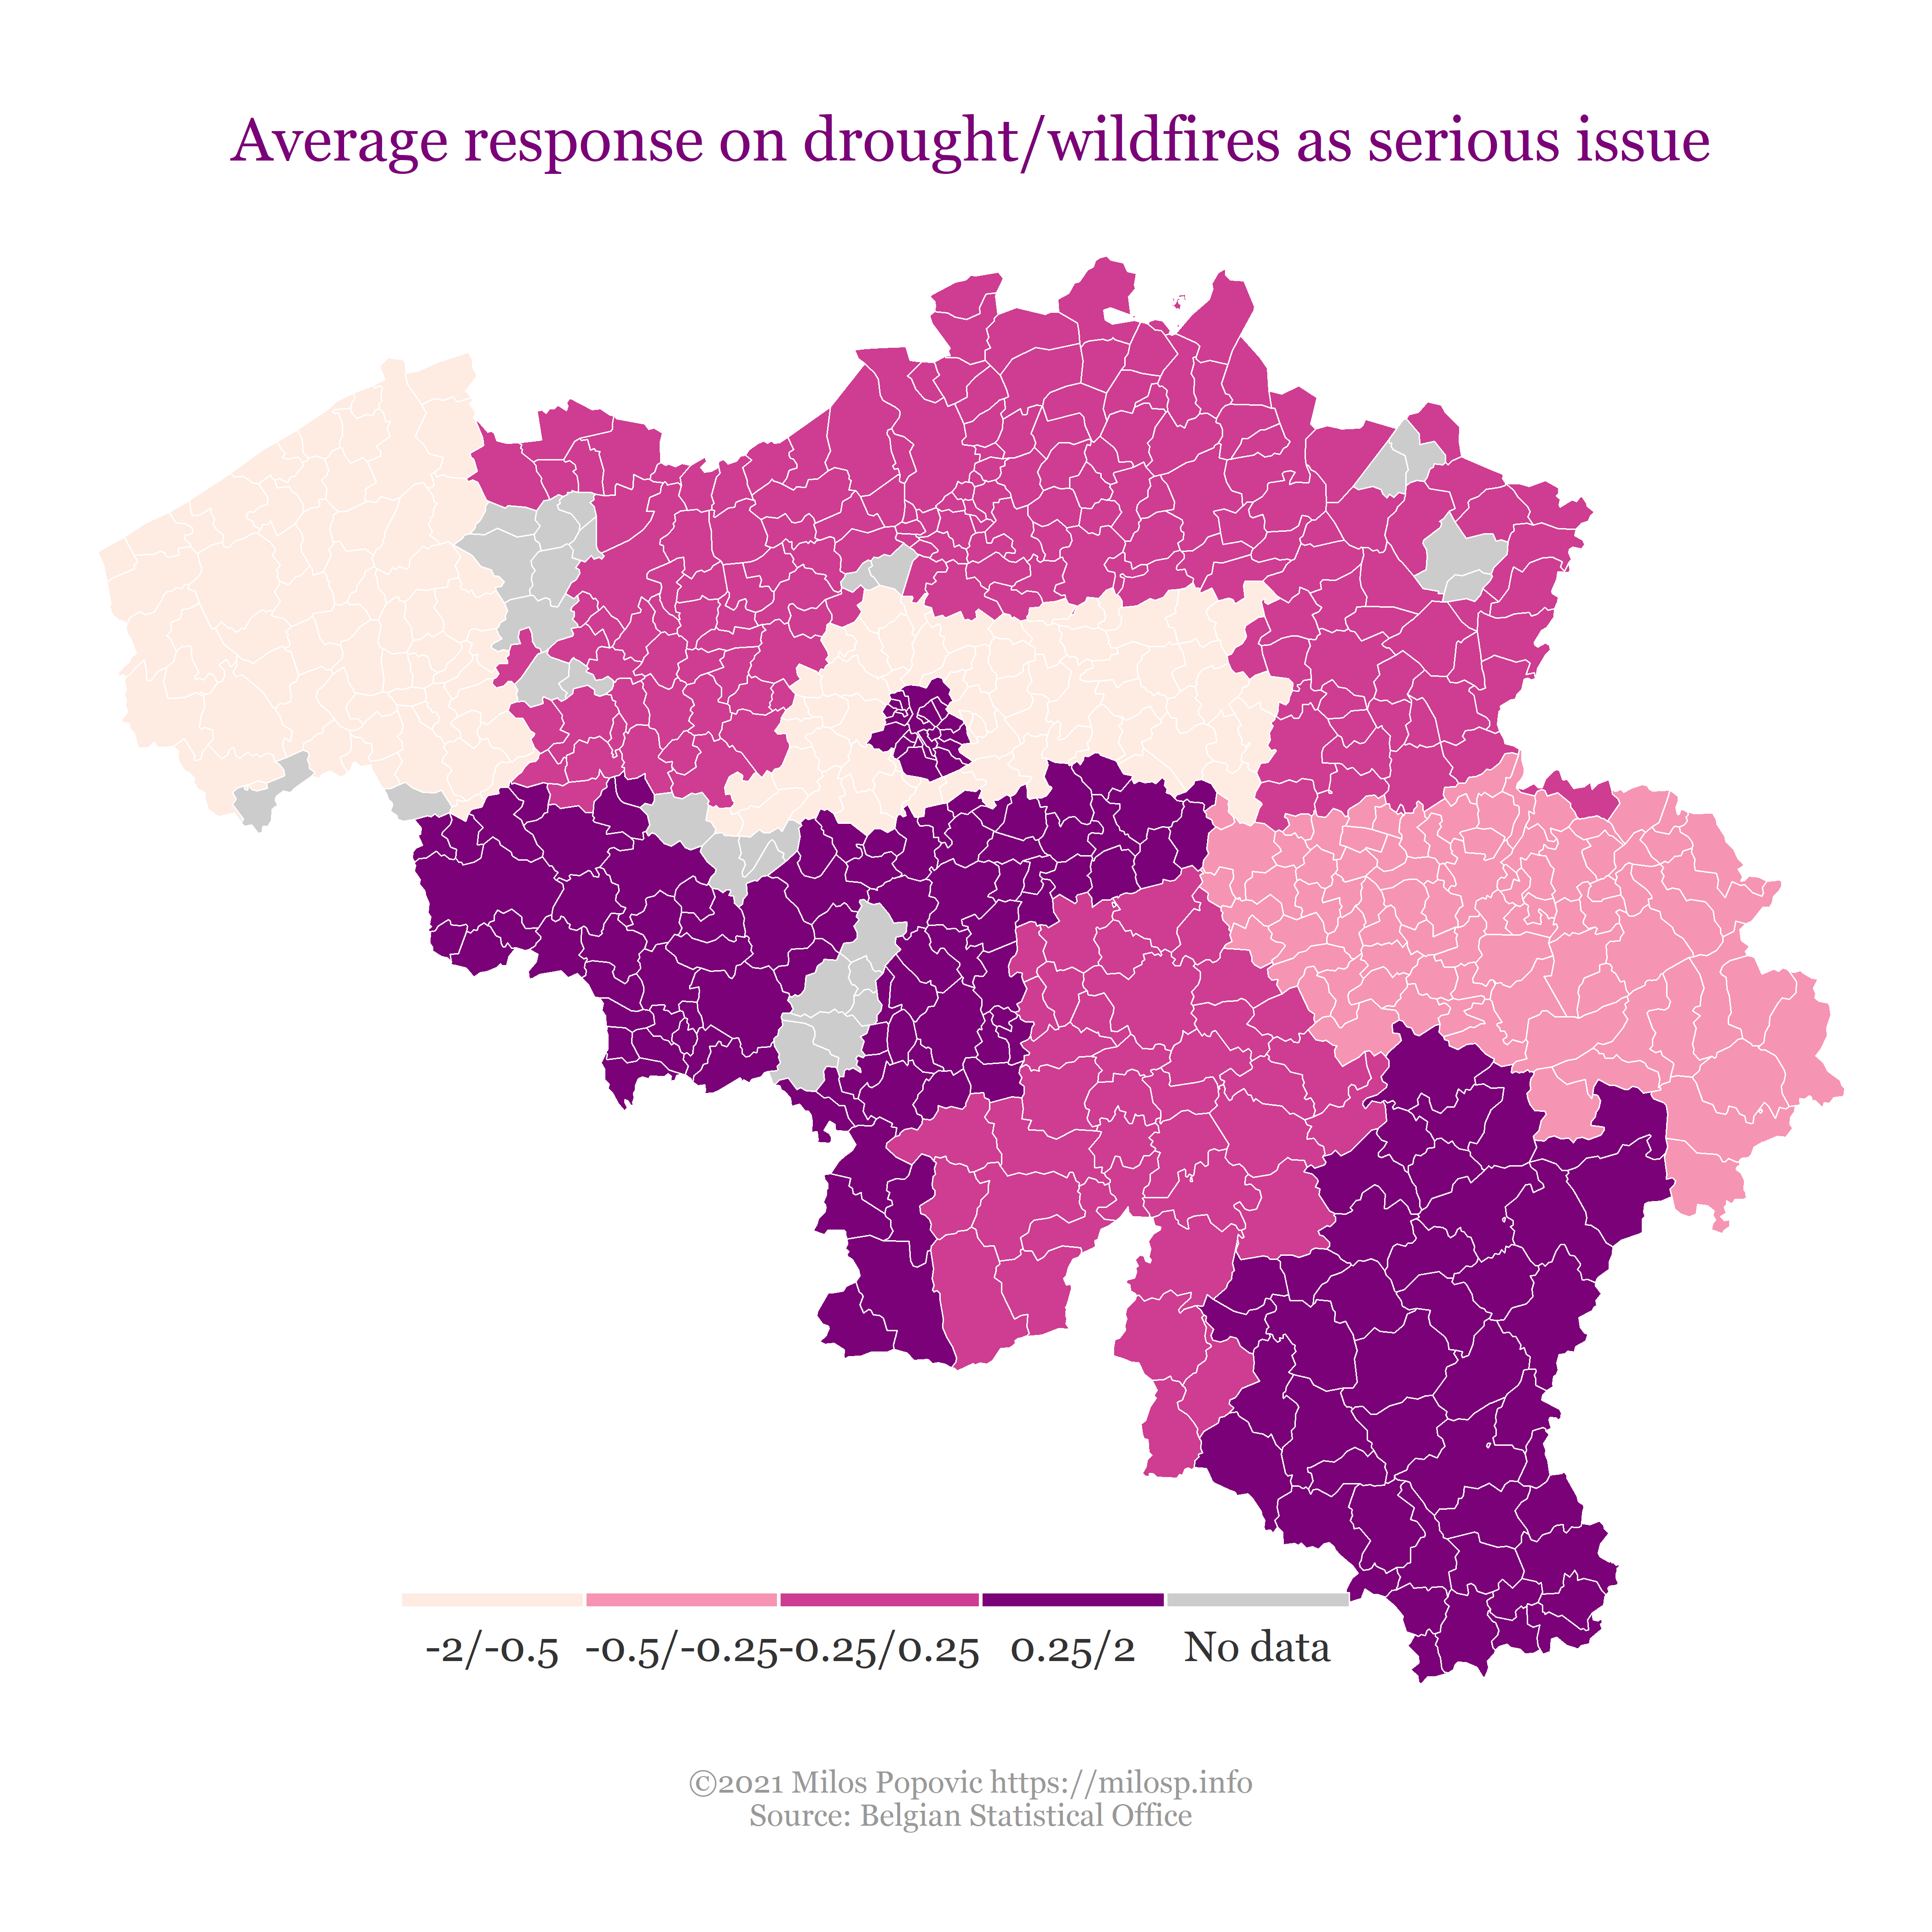
We projected the public opinion data from Eurobarometer 90.2 (fieldwork:
October-November 2018.) on the municipal map of Belgium. We used the
answers to the multiple choice question
QB1 Do you think that the following extreme weather events are due to climate change?
We highlighted areas where people find it more likely to be exposed to
Droughts and wildfires. We used the GESIS datafile (European
Commission 2019) and used the (Antal 2021b, 2021a) packages to project
the values to municipalities.
We see a weak spatial correlation between awareness of drought risk and actual draught risk. The least affected parts of Belgium appear least concerned. Despite its weakness, authorities and insurers can at least build their mitigation policies on a hypothesis of positive correlation. Of note is that concern for climate change effects follows regional, linguistic and other patterns. The map in particular suggests the Belgian provinces as markers for awareness.
Financial Capacity to Pay for Insurance
The next question we asked ourselves, was if the drought risk correlates with the ability to pay as distributed among local communities. Whether an insurance policy – or the regulation of insurance – attempts to provide cover on an individual level (through increased premia), or looks for local, regional or national mitigation strategies, the income/tax base might be an appropriate benchmark to test for financial capacity.
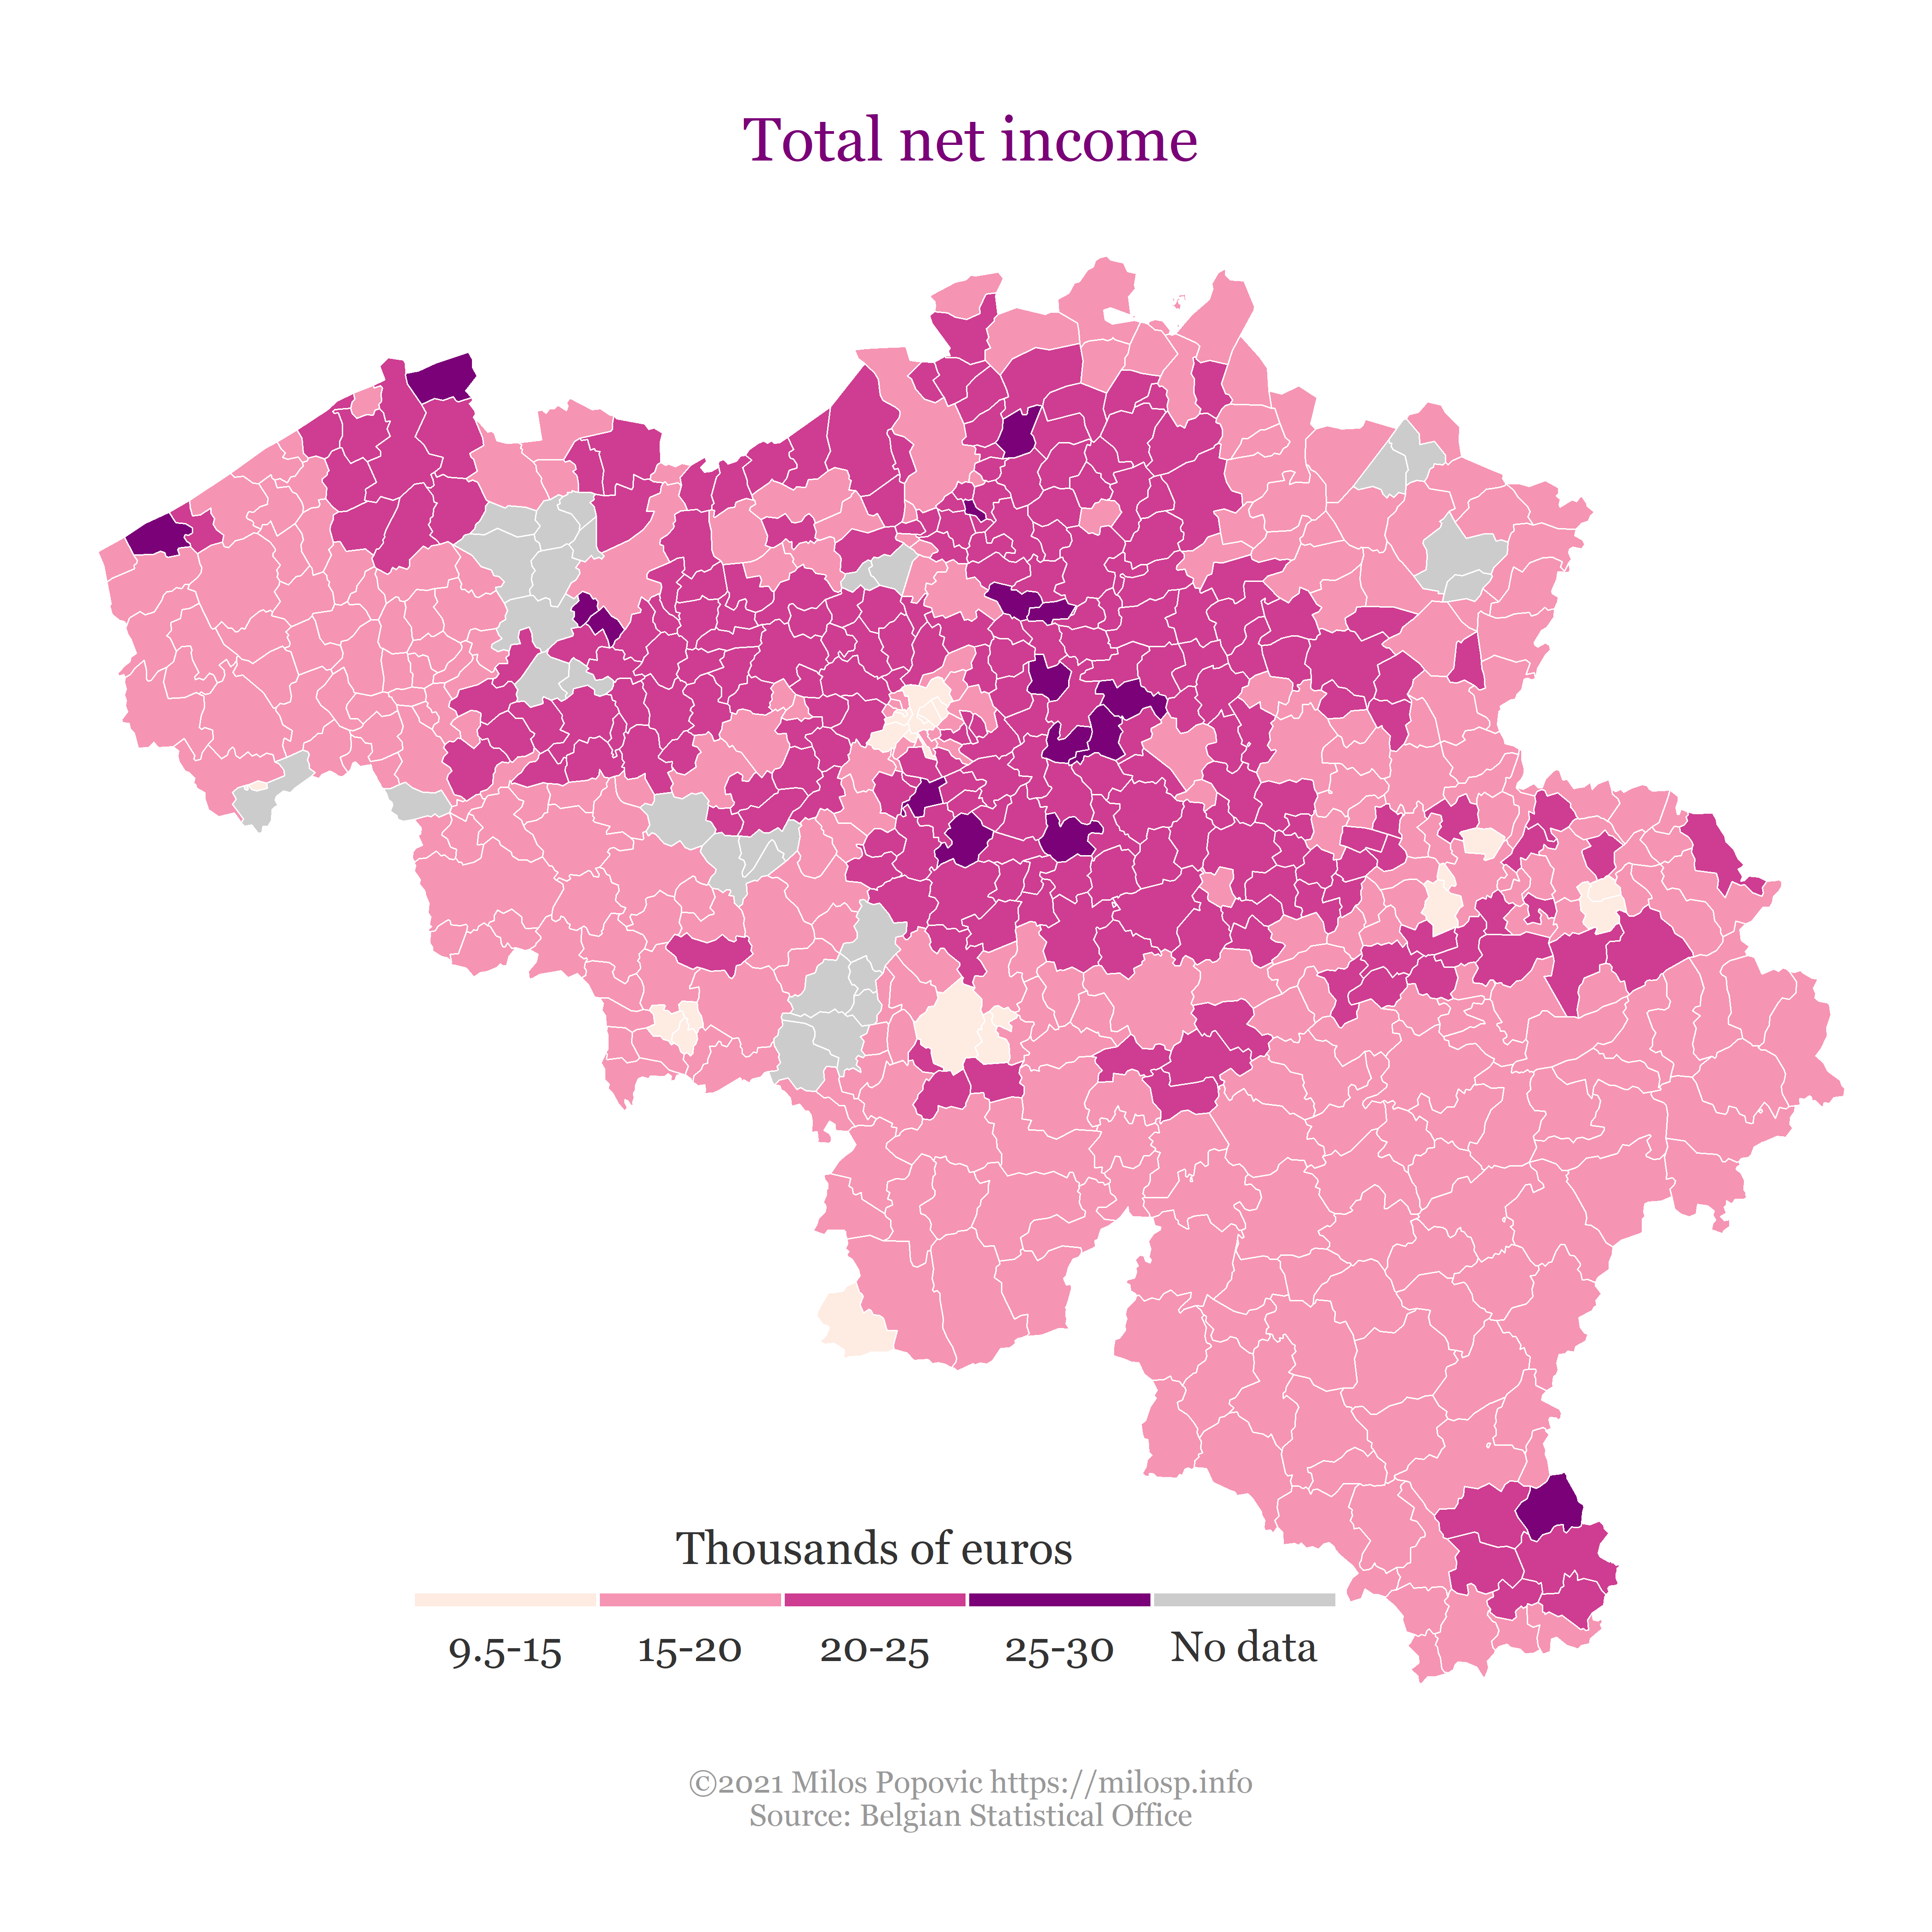
The match between the (inverted) SPEI and total net income is less than perfect. Some of the areas most at risk coincide with the highest-income communities, but other threatened communities are low-income by Belgian standards. The actual risk awareness and the financial capacity to solve the problem are again only weakly correlated.^[2]
Correlation
Let’s have a look at the variables on NUTS3 level:
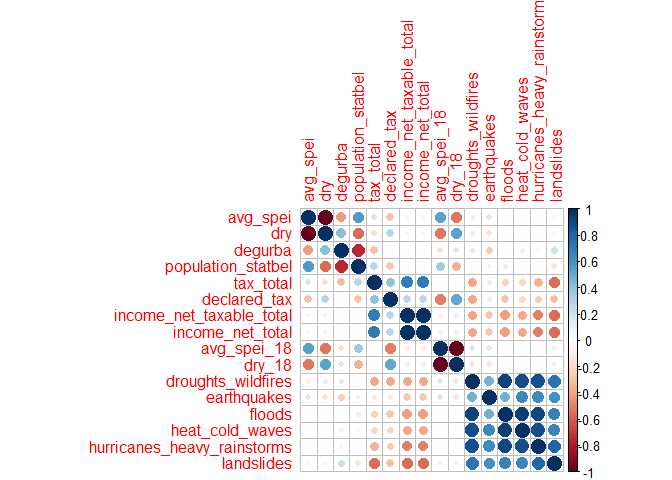
Average SPEI, which is a measure of increasing humidity, is negatively correlated withdrythat we defined as-1 x avg_spei.Dryareas, that are losing water, are less populous and more rich regions.Dry_18is a version of dry that only shows 12 months before the Eurobarometer survey about opinions on climate change effects, to see if the recent memory of actual weather conditions has had an affect of the perception of Belgians about these risk. It is seemingly not correlated with worries about floods or droughts.- The
dry_18and thedryvariables are largely correlated. One possible explanation is that the year before the survey was not an unusual period, it fit very well with the 2016-2020 trend. - Worries about extreme weather conditions are correlated with each other – i.e., some part of the population (concentrated geographically) is far more concerned with climate change than others.
The same on municipality (local administrative unit) level:
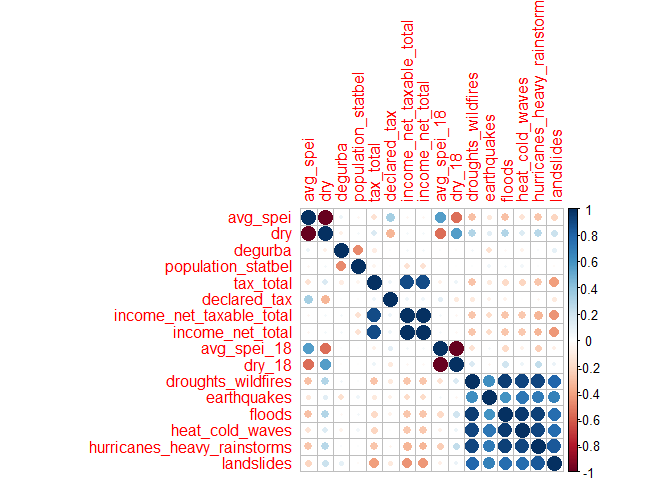
The correlations with opinion polling data are a little bit distorted,
because the data is on NUTS2, and to bring it down to NUTS3 or LAU
level would be a complicated small area statistical estimation task. We
have also computed geospatial cross-correlation. Awareness of the
climate problem and the dryness in 2018 were positively correlated in
time – the drier the year was in an area, the more likely it was that
people are aware of the problem; and the poorer areas were more likely
to be afraid of this problem. The global spatial cross-correlation of
the drying and local income was very low. This is a neutral situation:
local income is not more concentrated to drying areas (which would be a
lucky coincidence) nor concentrated in the relatively stable areas.
Generally, the problem map appears to be neutral to mildly favorable. The financial capacity to solve the problem is not working in the favor, nor against the problem, and awareness seems to be somewhat higher in the more affected areas.
The codes are in R/join_belgium_water_lau_dataset.R and
R/join_belgium_water_nuts3_dataset.R.
Adverse Selection and Climate Solidarity
In addition to these historical analyses that put the drought risk in context, we are investigating whether climate data from integrated climate models might be harnessed to predict medium- to longer-term risk profiles on a spatially distributed basis. Urban planners, real estate promoters, individual households and governments will need to rely on such predictions to better adapt to climate change and reverse some of the earlier policy choices we mentioned.
To quote the Nobel Prize winning thoughts of Finn E. Kydland and Edward C. Prescott (Kydland and Prescott 1977):
The issues are obvious in many well-known problems of public policy. For example, suppose the socially desirable outcome is not to have houses built in a particular flood plain but, given that they are there, to take certain costly flood-control measures. If the government’s policy were not to build the dams and levees needed for flood protection and agents knew this was the case, even if houses were built there, rational agents would not live in the flood plains. But the rational agent knows that, if he and others build houses there, the government will take the necessary flood-control measures. Consequently, in the absence of a law prohibiting the construction of houses in the flood plain, houses are built there, and the army corps of engineers subsequently builds the dams and levees.
Our initial explorations at least suggest that leaving the resolution entirely to market forces, for example through increased property insurance premia may well lead to underinsurance in poorer areas that is dynamically inconsistent with government policy. If in particular severe drought will bankrupt farmers in such areas, eventually regional or national government will be forced to bail them out.
The other extreme approach, i.e., leaving the climate-change related damages entirely to the taxpayer, therefore does not seem feasible either with climate awareness and local income tax base only weakly correlating with the drought patterns. In addition, drought of course does not confine itself to municipal borders; the hydrological topology of the issue inherently implies a coordination problem between local, regional and federal entities passing the buck from one to another. One can imagine some form of solidarity and redistribution will be required to align interests and avoid adverse selection. To address these typical market failures, government will need to step in to allow these risks, that may be privately uninsurable, to be covered on a society-wide basis.
These problems are not unique to property damage. Similar problems arise in many student loan systems in the world (where it is desirable that the loan can be taken by arts students or future teachers, who may not have as high earning potential as easy-to-credit future lawyers, engineers, managers) or in many social security issues: a minimum level of health insurance for the unemployed and poor is desirable not only on the basis of humanity, but to avoid epidemic risks. Such special loan systems and special insurance systems are balancing some social welfare with individual welfare and individual risk considerations, and at the same time they try to avoid adverse selection, free-riding. We believe that our example can spark some ideas how a desirable social outcome can be aligned with the principles of insurance and personal responsibility.
In this case, on a longer term basis, incentives that may transfer water-intensive industrial and agricultural activities from the areas most at risk, could be called for, as well as better hydrological management to safeguard water reserves. We invite the authorities and relevant stakeholders to render the appropriate data needed to assess climate and drought evolution and to calculate risk premia scenarios and solidarity mechanisms open data, verified for quality through unit-tests and peer review.
References
Antal, Daniel. 2021a. Regions: Processing Regional Statistics. https://regions.danielantal.eu/.
———. 2021b. Retroharmonize: Ex Post Survey Data Harmonization. https://retroharmonize.dataobservatory.eu/.
Beguerı́a, Santiago, Sergio M Vicente-Serrano, Fergus Reig, and Borja Latorre. 2014. “Standardized Precipitation Evapotranspiration Index (SPEI) Revisited: Parameter Fitting, Evapotranspiration Models, Tools, Datasets and Drought Monitoring.” International Journal of Climatology 34 (10): 3001–23.
European Commission. 2019. “Eurobarometer 90.2 (2018).” GESIS Data Archive, Cologne. ZA7488 Data file Version 1.0.0, https://doi.org/10.4232/1.13289. https://doi.org/10.4232/1.13289.
Kydland, Finn E., and Edward C. Prescott. 1977. “Rules Rather Than Discretion: The Inconsistency of Optimal Plans.” Journal of Political Economy 85 (3): 473–91. http://www.jstor.org/stable/1830193.
Statbel. 2020. “Fiscal statistics on income.” Eurostat. https://statbel.fgov.be/en/open-data/fiscal-statistics-income.
Vicente-Serrano, Sergio M, Santiago Beguerı́a, and Juan I López-Moreno. 2010. “A Multiscalar Drought Index Sensitive to Global Warming: The Standardized Precipitation Evapotranspiration Index.” Journal of Climate 23 (7): 1696–1718.
As a standardized variate, SPEI can be compared across space and time. The original calculation of SPEI is based on the FAO-56 Penman-Monteith method. Other relevant indicators might consider the soil composition for example: clay and lime soils tend to be more vulnerable to drought. We combined this ecological dimension with the socio-economic dimension to suggest that insurance premia design might be targeted to, say, income levels as well - or alternatively to real estate prices. See (Beguerı́a et al. 2014; Vicente-Serrano, Beguerı́a, and López-Moreno 2010) ↩︎
Daniel Antal
Data Scientist & Founder of the Digital Music Observatory
My research interests include reproducible social science, economics and finance.
Karel Volkaert
Climate policy and mitigation data curator
My research interests encompass quantitative social science, political analysis and data visualization.
Milos Popovic
Contributor, geographical data and maps
My research interests encompass quantitative social science, political analysis and data visualization.